FIA Reports: Difference between revisions
(Minor correction) |
(Added mobile device section) |
||
| (2 intermediate revisions by the same user not shown) | |||
| Line 3: | Line 3: | ||
This screen allows you to run any or all of the FIA reports. | This screen allows you to run any or all of the FIA reports. | ||
<gallery widths=600px heights=340px perrow=1> | <gallery widths="600px" heights="340px" perrow="1"> | ||
Image:CTLTMS_FIA_Reports.png|''FIA Report Selection'' | Image:CTLTMS_FIA_Reports.png|''FIA Report Selection'' | ||
</gallery> | </gallery> | ||
| Line 13: | Line 13: | ||
When a report is run, this will open in a new tab and display the results. | When a report is run, this will open in a new tab and display the results. | ||
<gallery widths=600px heights=340px perrow=1> | <gallery widths="600px" heights="340px" perrow="1"> | ||
Image:CTLTMS_FIA_Reports_Results.png|''Reports'' | Image:CTLTMS_FIA_Reports_Results.png|''Reports'' | ||
</gallery> | </gallery> | ||
You can also print the report using the browser Print option. When printed in this way, the results are paginated for printing and include an initial page and summary. | You can search each results table for specific records using the ''Search'' box provided and export the data from each result table to CSV, PDF or the clipboard using the buttons provided. These options will be shown when you hover your mouse over the table in the report. {{Note}}You cannot hover on a mobile device and therefore these options are not available on mobile devices. | ||
You can also print the report using the browser Print option. When printed in this way, the results are paginated for printing and include an initial page and summary. {{Note}}For mobile devices, you may instead need to use the ''Share'' option from the hamburger menu of the device's browser window. | |||
| Line 29: | Line 30: | ||
This section summarises the customer fleet across the organisation and by location by vehicle class. | This section summarises the customer fleet across the organisation and by location by vehicle class. | ||
<gallery widths=600px heights=340px perrow=1> | <gallery widths="600px" heights="340px" perrow="1"> | ||
Image:CTLTMS_FIA_Reports_Results_Company_Summary.png|''Reports'' | Image:CTLTMS_FIA_Reports_Results_Company_Summary.png|''Reports'' | ||
</gallery> | </gallery> | ||
| Line 37: | Line 38: | ||
This section shows detail of each inspection of each vehicle in the fleet in the period. | This section shows detail of each inspection of each vehicle in the fleet in the period. | ||
<gallery widths=600px heights=340px perrow=1> | <gallery widths="600px" heights="340px" perrow="1"> | ||
Image:CTLTMS_FIA_Reports_Results_Inspection.png|''Reports'' | Image:CTLTMS_FIA_Reports_Results_Inspection.png|''Reports'' | ||
</gallery> | </gallery> | ||
| Line 45: | Line 46: | ||
This section shows a summary of percentage tyre brands installed on vehicles in the fleet. | This section shows a summary of percentage tyre brands installed on vehicles in the fleet. | ||
<gallery widths=600px heights=340px perrow=1> | <gallery widths="600px" heights="340px" perrow="1"> | ||
Image:CTLTMS_FIA_Reports_Results_Tyre_Brand.png|''Reports'' | Image:CTLTMS_FIA_Reports_Results_Tyre_Brand.png|''Reports'' | ||
</gallery> | </gallery> | ||
| Line 52: | Line 53: | ||
This section shows a summary of percentage tyre sizes installed on vehicles in the fleet. | This section shows a summary of percentage tyre sizes installed on vehicles in the fleet. | ||
<gallery widths=600px heights=340px perrow=1> | <gallery widths="600px" heights="340px" perrow="1"> | ||
Image:CTLTMS_FIA_Reports_Results_Tyre_Size.png|''Reports'' | Image:CTLTMS_FIA_Reports_Results_Tyre_Size.png|''Reports'' | ||
</gallery> | </gallery> | ||
| Line 60: | Line 61: | ||
This section shows a summary of percentage expected tyre life of tyres installed on vehicles in the fleet. | This section shows a summary of percentage expected tyre life of tyres installed on vehicles in the fleet. | ||
<gallery widths=600px heights=340px perrow=1> | <gallery widths="600px" heights="340px" perrow="1"> | ||
Image:CTLTMS_FIA_Reports_Results_Tyre_Life.png|''Reports'' | Image:CTLTMS_FIA_Reports_Results_Tyre_Life.png|''Reports'' | ||
</gallery> | </gallery> | ||
| Line 70: | Line 71: | ||
* By Axle Type | * By Axle Type | ||
<gallery widths=600px heights=340px perrow=1> | <gallery widths="600px" heights="340px" perrow="1"> | ||
Image:CTLTMS_FIA_Reports_Results_Pressure.png|''Reports'' | Image:CTLTMS_FIA_Reports_Results_Pressure.png|''Reports'' | ||
</gallery> | </gallery> | ||
| Line 80: | Line 81: | ||
* Detail by Tyre Life i.e. New, Remould, New/Regrooved, Remould/Regrooved. | * Detail by Tyre Life i.e. New, Remould, New/Regrooved, Remould/Regrooved. | ||
<gallery widths=600px heights=340px perrow=1> | <gallery widths="600px" heights="340px" perrow="1"> | ||
Image:CTLTMS_FIA_Reports_Results_Tread_Depth.png|''Reports'' | Image:CTLTMS_FIA_Reports_Results_Tread_Depth.png|''Reports'' | ||
</gallery> | </gallery> | ||
| Line 89: | Line 90: | ||
* Issues and Actions - a detailed list of all issues and actions in the period. | * Issues and Actions - a detailed list of all issues and actions in the period. | ||
<gallery widths=600px heights=340px perrow=1> | <gallery widths="600px" heights="340px" perrow="1"> | ||
Image: | Image:CTLTMS_FIA_Reports_Results_Problems.png|''Reports'' | ||
</gallery> | </gallery> | ||
<gallery widths=600px heights=340px perrow=1> | <gallery widths="600px" heights="340px" perrow="1"> | ||
Image: | Image:CTLTMS_FIA_Reports_Results_Actions.png|''Reports'' | ||
</gallery> | </gallery> | ||
| Line 107: | Line 108: | ||
* ''Notes'' - any notes on the above | * ''Notes'' - any notes on the above | ||
* ''Status'' - whether this action is closed or open. | * ''Status'' - whether this action is closed or open. | ||
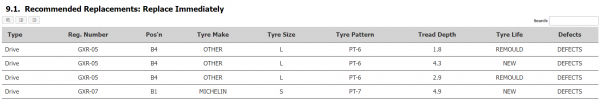
== Recommended Replacements == | == Recommended Replacements == | ||
| Line 117: | Line 117: | ||
* Within 2-3 months | * Within 2-3 months | ||
<gallery widths=600px heights=340px perrow=1> | <gallery widths="600px" heights="340px" perrow="1"> | ||
Image: | Image:CTLTMS_FIA_Reports_Results_Replace_Summary.png|''Reports'' | ||
Image: | Image:CTLTMS_FIA_Reports_Results_Replace_Immediate.png|''Reports'' | ||
</gallery> | </gallery> | ||
Latest revision as of 14:03, 3 December 2025
This is the FIA (Fleet Inspection Analysis reporting screen.
This screen allows you to run any or all of the FIA reports.
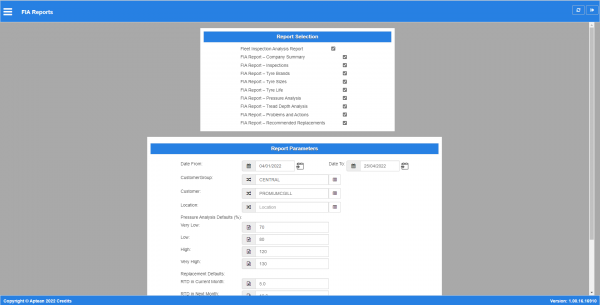
FIA Report Selection

You can choose the sections of the report to run here, and enter the report parameters.
You can clear the parameters, reset to the defaults or run the report from the buttons provided.
When a report is run, this will open in a new tab and display the results.
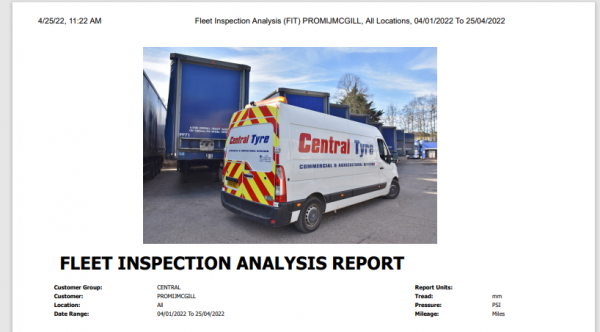
Reports

You can search each results table for specific records using the Search box provided and export the data from each result table to CSV, PDF or the clipboard using the buttons provided. These options will be shown when you hover your mouse over the table in the report. ![]() Note: You cannot hover on a mobile device and therefore these options are not available on mobile devices.
Note: You cannot hover on a mobile device and therefore these options are not available on mobile devices.
You can also print the report using the browser Print option. When printed in this way, the results are paginated for printing and include an initial page and summary. ![]() Note: For mobile devices, you may instead need to use the Share option from the hamburger menu of the device's browser window.
Note: For mobile devices, you may instead need to use the Share option from the hamburger menu of the device's browser window.
The report is made up of several sections, each of which can be run separately.
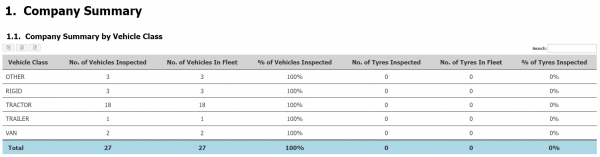
Company Summary
This section summarises the customer fleet across the organisation and by location by vehicle class.
Reports

Inspections
This section shows detail of each inspection of each vehicle in the fleet in the period.
Reports

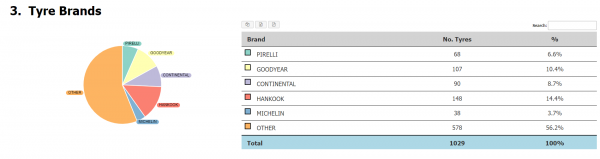
Tyre Brands
This section shows a summary of percentage tyre brands installed on vehicles in the fleet.
Reports

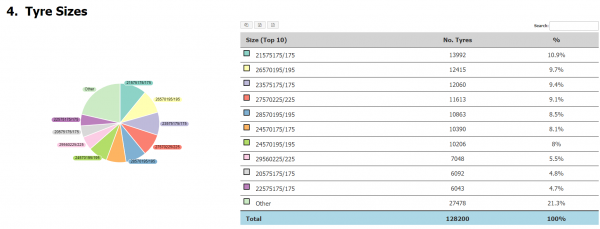
Tyre Sizes
This section shows a summary of percentage tyre sizes installed on vehicles in the fleet.
Reports

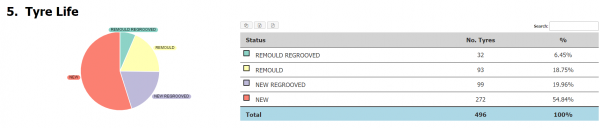
Tyre Life
This section shows a summary of percentage expected tyre life of tyres installed on vehicles in the fleet.
Reports

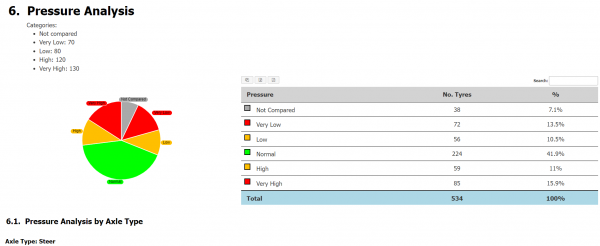
Pressure Analysis
This section shows comparisons of the recorded pressure within the period, with multiple subsections as follows:
- Summary
- By Axle Type
Reports

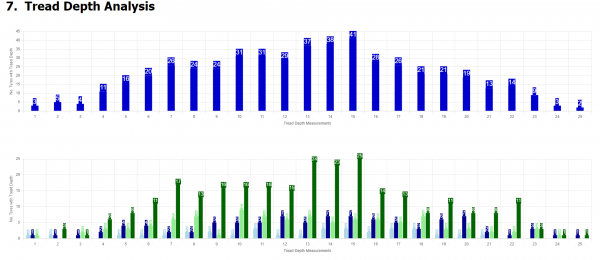
Tread Depth Analysis
This section shows the recorded tread depths within the period in two bar charts:
- Summary across all tyre life
- Detail by Tyre Life i.e. New, Remould, New/Regrooved, Remould/Regrooved.
Reports

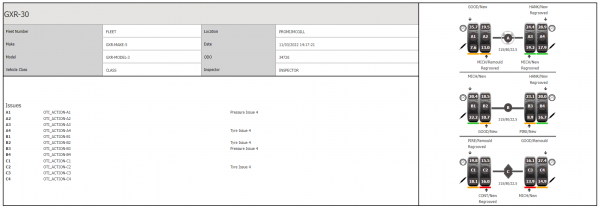
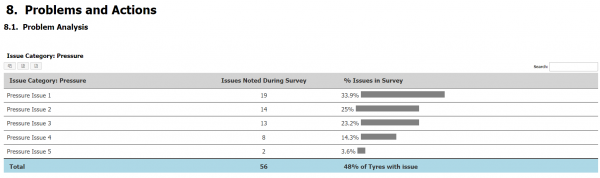
Problems and Actions
The section shows several subsections:
- Problem Analysis, a summary showing the percentage of issues noted during the fleet inspections in the period, categorised by Tyre or Pressure issues.
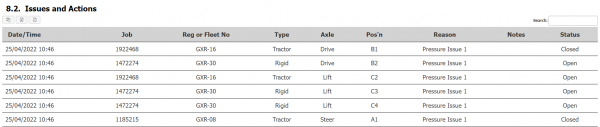
- Issues and Actions - a detailed list of all issues and actions in the period.
Reports

Reports

The detail section shows the following information:
- Date/Time
- Job
- Reg or Fleet No - the vehicle.
- Type - the vehicle type.
- Axle - the axle type
- Position - the tyre position
- Reason - the noted action.
- Notes - any notes on the above
- Status - whether this action is closed or open.
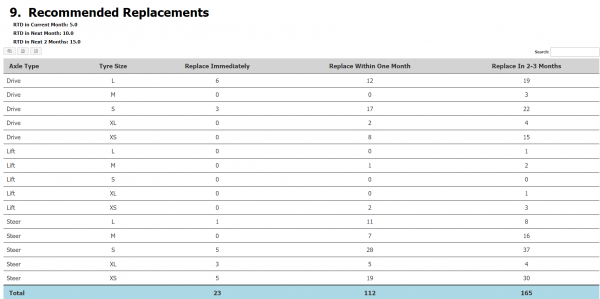
Recommended Replacements
This section will show tables of recommended replacements based on tread depth in the following categories:
- Summary - a count of all recommended replacements.
- Immediately
- Within 1 month
- Within 2-3 months
Reports
Reports


The results show:
- Type - axle type.
- Reg. Number - vehicle.
- Position - tyre position.
- Tyre Make
- Tyre Size
- Tyre Pattern
- Tread Depth
- Tyre Life - New/Remould and/or Regrooved.
- Defects - a list of the reported defects