Monitor: Difference between revisions
From Vision
No edit summary |
No edit summary |
||
| Line 8: | Line 8: | ||
File:Monitor3.PNG|Connected Users by Activity (WCS) | File:Monitor3.PNG|Connected Users by Activity (WCS) | ||
</gallery> | </gallery> | ||
<table border="1"> | |||
<tr><td>Name</td><td>Description</td></tr> | |||
<tr><td>WCS</td><td></td></tr> | |||
<tr><td>Loading Tasks</td><td>A Pie Chart to show the loading tasks</td></tr> | |||
<tr><td>Pick and Loading</td><td>A graph of Highest Picker Productivity, plus a pie chart of the Loading tasks on the system</td></tr> | |||
<tr><td>Pick Productivity</td><td>A graph to show the Highest 10 productive Pickers</td></tr> | |||
<tr><td>Shift Summary Graph</td><td>A graph to compare the productivity/tasks completed of all the shifts in all the task types.</td></tr> | |||
<tr><td>Warehouse Summary Graph</td><td>A Pie chart showing the percentage of tasks completed in the warehouse, per task type.</td></tr> | |||
<tr><td>Warehouse Weekly Summary Graph</td><td>A line graph of the productivity figures achieved and number of tasks completed for the last 7 days, by task type, for the warehouse</td></tr> | |||
<tr><td>WMS</td><td></td></tr> | |||
<tr><td>Shift Summary Graph</td><td>A graph to compare the tasks completed of all the shofts in all the task types.</td></tr> | |||
<tr><td>Warehouse Summary Chart</td><td>A Pie chart showing the percentage of tasks completed in the warehouse, per task type.</td></tr> | |||
<tr><td>Warehouse Weekly Summary Graph</td><td>A line graph of the tasks completed for the last 7 days, by task type, for the warehouse.</td></tr> | |||
</table> | |||
Revision as of 17:38, 25 November 2010
Monitor screens are bespoke to the systems being mined. Essentially they are screens designed to show the status of individual portions of the external systems, to aid in problem-solving.
A selection of these screens is shown below:
Order Status (WMS)

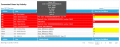
Current Exceptions (WCS)
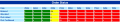
Connected Users by Activity (WCS)
| Name | Description |
| WCS | |
| Loading Tasks | A Pie Chart to show the loading tasks |
| Pick and Loading | A graph of Highest Picker Productivity, plus a pie chart of the Loading tasks on the system |
| Pick Productivity | A graph to show the Highest 10 productive Pickers |
| Shift Summary Graph | A graph to compare the productivity/tasks completed of all the shifts in all the task types. |
| Warehouse Summary Graph | A Pie chart showing the percentage of tasks completed in the warehouse, per task type. |
| Warehouse Weekly Summary Graph | A line graph of the productivity figures achieved and number of tasks completed for the last 7 days, by task type, for the warehouse |
| WMS | |
| Shift Summary Graph | A graph to compare the tasks completed of all the shofts in all the task types. |
| Warehouse Summary Chart | A Pie chart showing the percentage of tasks completed in the warehouse, per task type. |
| Warehouse Weekly Summary Graph | A line graph of the tasks completed for the last 7 days, by task type, for the warehouse. |
Back to Main Page