Main Page: Difference between revisions
| Line 22: | Line 22: | ||
==Introduction== | ==Introduction== | ||
The purpose of the Calidus Vision product is to allow visibility of productivity, system and business information through the use of graphs, charts and data lists. | The purpose of the Calidus ''Vision'' product is to allow visibility of productivity, system and business information through the use of graphs, charts and data lists. | ||
There is a business need to extract and see information regarding the operation and its performance within the warehouse. | There is a business need to extract and see information regarding the operation and its performance within the warehouse. | ||
| Line 64: | Line 64: | ||
==Parameters== | ==Parameters== | ||
The data mining database has been created to allow the entry of parameters to show Minimum and Desired Productivity rates for each functional area. | The data mining database has been created to allow the entry of parameters to show Minimum and Desired Productivity rates for each functional area. | ||
As the data mining tools are further developed, this will also include: | As the data mining tools are further developed, this will also include: | ||
| Line 70: | Line 69: | ||
==Calidus Vision Front-End== | ==Calidus ''Vision'' Front-End== | ||
The Calidus Vision web front end displays the data on timed changing display, optionally displaying the data in forms, graphs and tables. | The Calidus ''Vision'' web front end displays the data on timed changing display, optionally displaying the data in forms, graphs and tables. | ||
This supports: | This supports: | ||
Revision as of 13:20, 27 August 2009
Calidus Vision
- System Guide
Introduction
The purpose of the Calidus Vision product is to allow visibility of productivity, system and business information through the use of graphs, charts and data lists.
There is a business need to extract and see information regarding the operation and its performance within the warehouse.
Therefore the Calidus Vision product will be used to display this information.
As Calidus 3pl-Mobile (the WCS) is highly used and must remain responsive at the highest level at all times, the data for Vision is \’mined\’ into a new database, where productivity analysis begins.
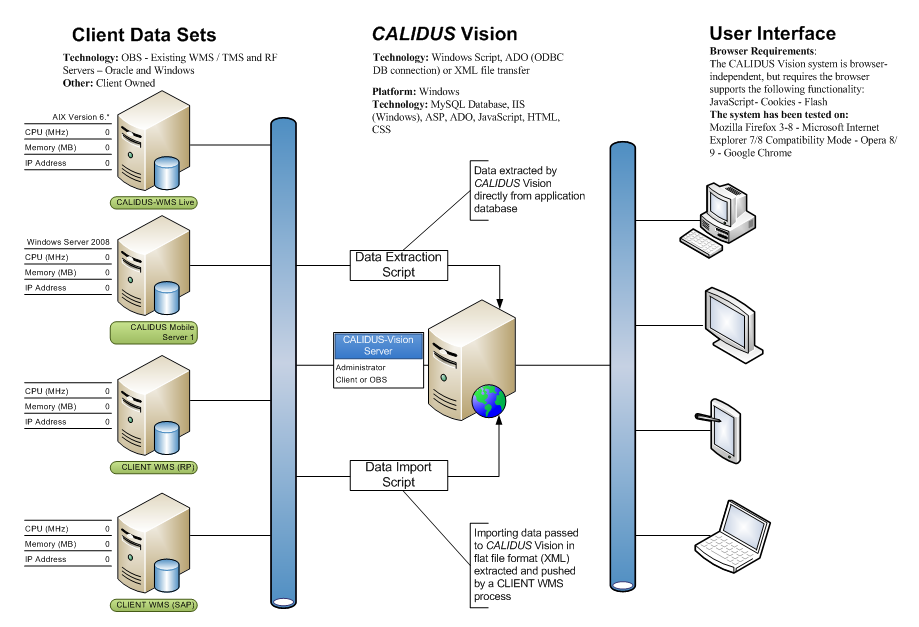
Network Diagram
In this instance, Calidus 3pl-Mobile exists on one server and the Data Mining process and Calidus Vision are on a separate server, for simplicity. As all of the processes are Windows-based, all could co-exist on the same server or be distributed to separate servers as required. Additionally, although the Data Mining Process and Application Server databases are separate in the diagram, they are normally combined.
Data Mining
OBS have created data mining processes for the extraction of system, activity and productivity data from the Calidus 3pl-Mobile database. System Data:
- Receipts in Progress
- Total Cases SKUs on Receipts
- Total number of SKUs on Receipts
- Number of Putaways and total quantity.
- Number of Moves and total quantity
- Number of Replens and total quantity
- Number of Full-pallet Picks and total quantity
- Number of Part-pallet picks and total quantity
- Number of Stock Take tasks
- Number and Status of loading tasks (Pending, Held, In Progress, Ready for Despatch)
Activity Data:
- All Activities performed by RF users
Productivity Data (Calculated from the Activity Data):
- Summary of number of tasks completed per day
- Detail of number of tasks completed per session
- Productivity figures derived from tasks per hour, per day.
Platform: Windows Technology: Windows Script, DAO, MySQL Database
Parameters
The data mining database has been created to allow the entry of parameters to show Minimum and Desired Productivity rates for each functional area.
As the data mining tools are further developed, this will also include:
- Historical analysis of productivity in functional areas, to learn productivity rates and predictions.
Calidus Vision Front-End
The Calidus Vision web front end displays the data on timed changing display, optionally displaying the data in forms, graphs and tables.
This supports:
- Productivity views (per task, per Warehouse/Owner/Employee, in days, weeks, months and quarters.
- System views, showing the current state of the system mined in terms of tasks outstanding.
- Enquiries on the data in tabular form.
- Graphs showing the overview system and productivity data.
- Client look & feel.
- Definable menu structure.
- Multiple information streams displayed on one form (2 horizontally, 2 vertically, 4 corners).
- Configurable timed displays (what screen are displayed, how long each is displayed).
- User-definable settings.
- User settings (limiting Company, Warehouse and Owner)
Platform: Windows/Linux Technology: IIS (Windows), ASP, DAO, JavaScript, HTML, CSS
