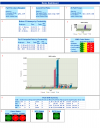
Dashboard
From Vision
Dashboards are screens that are designed to incorporate small amounts of the normal full-screen data, to allow for quick visibility of the information you need to see. In comparison to normal screens, Dashboards also refresh automatically every minute, to display changed data as soon as possible.
The screen is made up of plug-ins. The design and positioning of the plug-ins on a dashboard is currently undertaken by OBSL, but in the future, Vision will allow you to create your own dashboards.
A dashboard can contain any number of plug-ins, limited only by the screen width - the height will scroll automatically to contain all the plug-ins entered on the screen.
The plug-ins currently available are as follows:
- Predictor - more information on predictor screens can be found here. The Predictor plug-in allows a pre-defined predictor to be displayed on the screen.
- Task Productivity - the vast majority of Single Screens are a form of task productivity display, for example, Highest Part Pickers, Putaways Over Target, Current Part Pick Productivity. This plug-in can be configured to display them all, including RAG colouring for comparison versus targets.
- WMS Order Status - This plug-in displays the orders in the system for today, plus and minus a configurable number of days, to get a view of the progress your operation has made on order completion. This plug-in is identical in function to the Monitor screen of the same name, including drill-down to see the individual orders.
- Graphs and Charts - All Graphs can be displayed as Plug-ins, and can be resized to fit the space you have available on the dashboard. Currently the WCS Shift Activity Chart is available.
- WCS Shift Activity Summary - This summary plug-in is an example of a Summary Screen converted to a plug-in. In time, most summary screens will be available as plug-ins.
- Vision Status - This plug-in displays the current status of the Calidus Vision Data Mining processes enabled for your system, to indicate if there may be a problem with the system. The traffic lights display Red for Error. Amber for a possible problem and Green for running with no issues. Clicking on the traffic light will take you to the Event Log screen.
- WCS Status - This plug-in displays a traffic light to indicate if there are any exceptions raised by the WCS RF system. Again, RAG colours indicate Errors, Warnings or system running fine. Clicking on the traffic light will take you to the WCS Current Exceptions screen.
- WCS Users - This plug-in displays the number of RF users that are logged into your WCS system. Clicking on the traffic light will take you to the WCS Users screen.
- Warehouse Utilisation - This plug-in displays the percentage utilisation of the warehouse or areas within the warehouse, by location use type (i.e. Pick, Bulk, etc), with RAG colouration. Clicking on the plug-in will take you to the Aisles Utilisation screen.
- System Overview - This plug-in displays an overview of all the outstanding tasks in the warehouse.
- Warehouse Summary - This plug-in displays an overview of all tasks completed in the warehouse today.

