Demo Script CTMS
Introduction
Calidus Vision is a Visibility and Productivity tool, designed to represent data from diverse systems in a single view, displaying important information in meaningful screens designed to highlight performance and enhance visibility of issues in the host systems.
Log-on
You are prompted to enter a user-name and password.
Security: At the moment Calidus Vision is expected to be installed within a secure network, so no secure URL is provided, although this has been done through the Portal for added security and can be added on your local installation. The user-name and password are secured through the database log-on parameters - if the user-name is not valid on that system, you will not be able to log in. Further, if the session expires (through inactivity), the user will be required to log in again.
Main Screen
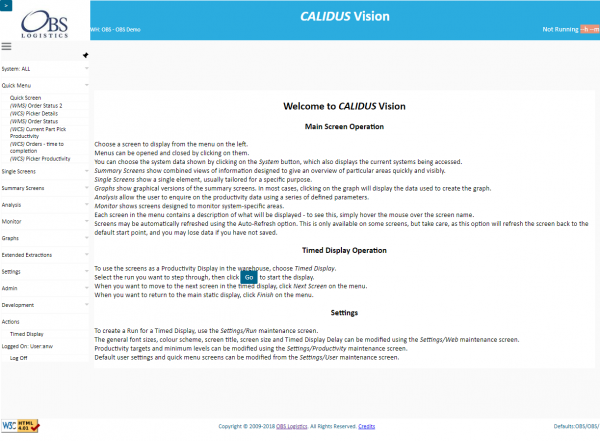
This Home screen shows a very brief help, showing how to use the main functions in the system.
Also shown are the menu options and systems that you are allowed to access. This is achieved through a user-definable menu structure and a security level against each configured user and against the screens, allowing many ways of configuring the system and the menus for your use.
You can filter the menu quickly by each System by using the System view drop-down from the main menu. This will remove all items that have no meaning to the system being accessed. For a generic implementation linking to a WMS and WCS, these (and potentially the Admin functions) will be the only available options on this Systems pop-up.
Systems that have been included are:
- Calidus TMS (or other TMS)
- Calidus WMS (or other WMS)
- Calidus Mobile (or other RF system)
There also exists a standard set of XML import files to allow different WMS or WCS systems to provide data feeds to Calidus Vision.
Menus
Quick Menu
The quick menu will be open upon starting the system. This is a set of screens chosen by the user (from any of their available screens) that they use every day.
Single Screens
Single screens are screens designed to show a single aspect of a data for a specific purpose.
For example:
- Orders Summary - this shows the total amount of picks available to be picked at the moment through the RF system.
- Daily Part Pick Productivity - this shows the actual performance of pickers on the current day, versus the target productivity rates.
TMS Screens
- Next Arrivals/Departures - Arrivals into and departures from the depot in the next 2 hours
- Trailer Utilisation - Haulier RPE utilisation information
- Tractor Utilisation - Fleet utilisation, per Carrier
- Driver Utilisation - Driver utilisation, per Carrier
Summary Screens
Summary screens combine single screens to bring information together in logical groups. Additionally they summarise figures across a group (warehouse, shift, owner) is order to provide an overview of progress within the operations.
For example:
- System and Warehouse Overview - This shows a panel of the current outstanding tasks available for users to complete, and a panel showing the tasks already completed by users on the current day.
- Current Productivity - This shows panels of 4 general tasks in the warehouse, showing the performance of employees in this area, versus the target productivity rates.
TMS Screens
- Trip Summary - Showing all the hours on the schedule, and the number of trips on each
- Trip Overview - A summary of all the trips from the depot.
- Orders Summary - Detailed information on the Orders within a depot.
Extended Extracts
Calidus Vision extracts and analyses all common task types (for example Picking, Receipt, Stock Take, Putaway, Replen). Some operations require that these task types be broken down further (for example, low and high part picking, picking from chill areas only). Extended Extractions are screens that show this detailed information in the way that the operation wants.
![]() Note: Due to the bespoke nature of the breakdown (i.e. very site specific), this is not something that can be demonstrated and is not configured within the generic system.
Note: Due to the bespoke nature of the breakdown (i.e. very site specific), this is not something that can be demonstrated and is not configured within the generic system.
Analysis & Enquiries
These screens allow you to view and extract detailed information over a time period.
For Example:
- Detail Enquiry - this shows all the historical productivity data.
You can query data through the fields offered.
You can Filter data once found.
You can sort the data.
You can Export the data to CSV or formatted output.
- Orders - Time To Completion - This shows the estimated amount of time required to complete the currently-available part picks in the operation.
Finding Screens Quickly
Note that this screen is one of the ones configured on this user's Quick Menu.
This can be configured through the User Settings screen.
Click on the User Quick Screens button and change the screens to be displayed (through the filter), the sequence, and save.
This methodology of sequencing screens is used throughout the system.
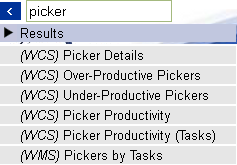
You can also access screens through a Search function on a pop-up toolbar.
Click the '>' button in the top left to show the pop-up toolbar options. Click Search and enter 'Status'. Click on Order Status 2.
Graphs
Graphs plot the data from the screens we have already seen (mostly the Summary screens) to provide a quick visible comparison of data. ![]() Warning: Your Browser must have Flash installed to display the Graphs.
Warning: Your Browser must have Flash installed to display the Graphs.
For example:
- Shift Summary screen - this shows a comparison of the average productivity of all shifts in the operation, over all task types. Note that you can click on the data bars and you will be shown the data used to calculate the information shown.
TMS Graphs
- Trip Overview - A pie chart showing the different statuses of trips in the depot.
- Trip Summary - A comparison on Planned versus Actual times for all trips on a schedule, per hour.
- Percentage Fill Hauliers/Trips - Bar graphs of the percentage fill for summarised per Depot, Haulier and Trip. RAG-coloured for easy planning.
Monitor
The Monitor screens show views of system-specific activities that require regular monitoring.
For example:
- Order Status/Order Status 2 - This provides a view of the orders being processed in the operation, from some days in the past to future requirements. The detail can be further enquired by clicking on a figure - you will then be shown the detailed information relating to orders at that status.
TMS Monitor
- Arrivals Departures
Settings
In these screens you will be able to configure the way that the system operates:
- Web - Here you can change the Look and Feel. For example, change the style to a different one, then reload the application using the button provided. There are many styles available, and more can be created (perhaps for a customer view).
- Productivity - Here you can maintain the Minimum and Target productivity levels, which directly affects the RAG colouration in the screens and extracts.
 Note: the system is multi-warehouse and multi-owner, allowing for a central installation.
 - Run - Here you can maintain the screens for a simple Dashboard. Screens can be added and removed, and the dashboards can be set to run on this terminal through the Actions/Timed Display menu option.
- There are also a range of System specific settings.
TMS Settings
You can enter the target PEV here.
Admin
The Admin screens allow changes of settings that affect how Vision runs. These are very restricted options (with a high security level) and should only be given to a select few supervisors. Examples:
- User Maintenance - Here you can add new users for the system and select what items they have available.
- Groups & Menu Maintenance - Here you can add and remove screens, and create new menu groups to apply to users (to restrict the screens available).
- Rules Maintenance - Here you can change settings on the system (for example, the RAG colours used, formats used for time and productivity fields and parameters for certain screens).


